Data exploration at your fingertips.
VisiData is an interactive multitool for tabular data. It combines the clarity of a spreadsheet, the efficiency of the terminal, and the power of Python, into a lightweight utility which can handle millions of rows with ease.
Install → Tutorial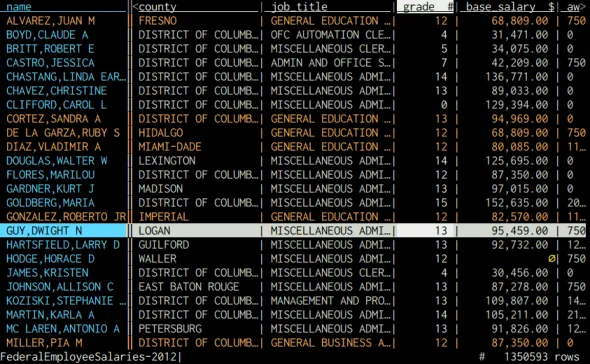
When you have
but you need
$
vd -b input.csv
Support us on Patreon
Become a Patron →Any data format
Open 1m+ rows in the blink of an eye.
Instant histogram with Shift + F
Press Enter to dive in.
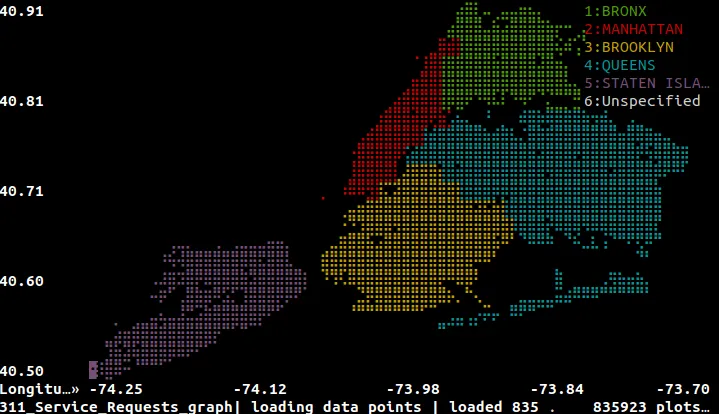
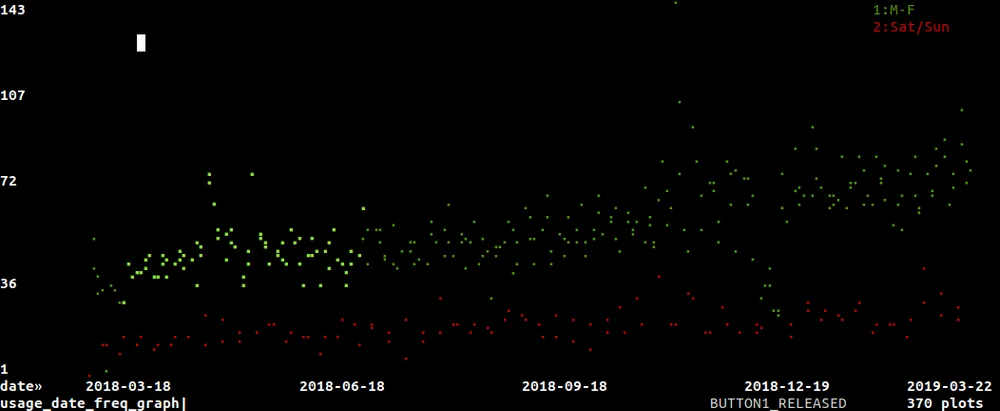
Scatterplots in the terminal
8-color maps.
Save sessions for replay later
Adhoc data pipelines in batch mode.
Get started with VisiData
I wonder if @visidata can.... Yes, yes it can. I love this tool.
A remarkably powerful and well-designed tool.
The tool I reach for first when I encounter a new dataset.